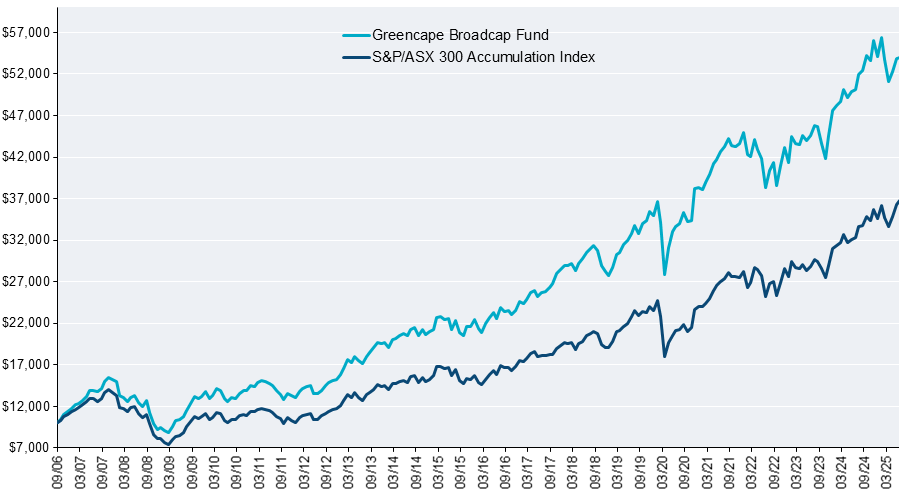
Broadcap Fund Performance
Fund Performance (Gross) as at 31 December 2025
| . | 3 months (%) | 1 year (%) | 3 years (%) p.a. | 5 years (%) p.a. | 10 years (%) p.a. | 15 years (%) p.a. | Since inception (%) p.a.* | |||
|---|---|---|---|---|---|---|---|---|---|---|
| Greencape Broadcap Fund | Fund | Gross Return | -1.14 | 2.23 | 10.89 | 8.45 | 10.60 | 10.58 | 10.66 | 1 |
| Greencape Broadcap Fund | ActiveReturn | Gross Active | -0.25 | -8.43 | -0.49 | -1.35 | 1.29 | 2.16 | 3.46 | 2 |
| Greencape Broadcap Fund | Fund | Net Return | -1.38 | 1.27 | 9.84 | 7.43 | 9.35 | 9.28 | 9.21 | 3 |
| Greencape Broadcap Fund | ActiveReturn | Net Active | -0.49 | -9.40 | -1.54 | -2.37 | 0.03 | 0.85 | 2.01 | 4 |
| S&P/ASX 300 Accumulation Index | Benchmark | Gross Return | -0.89 | 10.66 | 11.38 | 9.80 | 9.32 | 8.43 | 7.20 | 5 |
* Inception date is 11 September 2006. Returns are calculated before fees have been deducted, assuming reinvestment of distributions. No allowance is made for tax. Past performance is not a reliable indicator of future performance.
**Numbers may not add due to rounding.
**Numbers may not add due to rounding.
Fund Performance (Net) as at 31 December 2025
| . | 3 months (%) | 1 year (%) | 3 years (%) p.a. | 5 years (%) p.a. | 10 years (%) p.a. | 15 years (%) p.a. | Since inception (%) p.a.* | |||
|---|---|---|---|---|---|---|---|---|---|---|
| Greencape Broadcap Fund | Fund | Gross Return | -1.14 | 2.23 | 10.89 | 8.45 | 10.60 | 10.58 | 10.66 | 1 |
| Greencape Broadcap Fund | ActiveReturn | Gross Active | -0.25 | -8.43 | -0.49 | -1.35 | 1.29 | 2.16 | 3.46 | 2 |
| Greencape Broadcap Fund | Fund | Net Return | -1.38 | 1.27 | 9.84 | 7.43 | 9.35 | 9.28 | 9.21 | 3 |
| Greencape Broadcap Fund | ActiveReturn | Net Active | -0.49 | -9.40 | -1.54 | -2.37 | 0.03 | 0.85 | 2.01 | 4 |
| S&P/ASX 300 Accumulation Index | Benchmark | Gross Return | -0.89 | 10.66 | 11.38 | 9.80 | 9.32 | 8.43 | 7.20 | 5 |
* Inception date is 11 September 2006. Returns are calculated before fees have been deducted, assuming reinvestment of distributions. No allowance is made for tax. Past performance is not a reliable indicator of future performance.
**Numbers may not add due to rounding.
**Numbers may not add due to rounding.