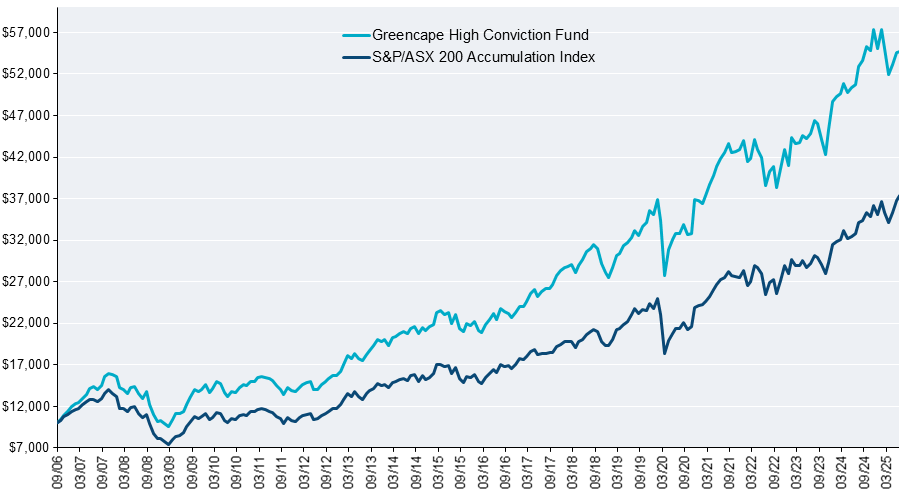
High Conviction Fund Performance
Fund Performance (Gross) as at 30 June 2026
| . | 3 months (%) | 1 year (%) | 3 years (%) p.a. | 5 years (%) p.a. | 10 years (%) p.a. | 15 years (%) p.a. | Since inception (%) p.a.* | |||
|---|---|---|---|---|---|---|---|---|---|---|
| Greencape High Conviction Fund | Fund | Gross Return | 2.48 | -0.85 | 7.27 | 6.18 | 10.31 | 10.01 | 10.10 | 1 |
| Greencape High Conviction Fund | ActiveReturn | Gross Active | -1.57 | -6.96 | -3.35 | -1.58 | 0.86 | 1.25 | 2.91 | 2 |
| Greencape High Conviction Fund | Fund | Net Return | 2.25 | -1.74 | 6.29 | 5.18 | 9.13 | 8.85 | 8.87 | 3 |
| Greencape High Conviction Fund | ActiveReturn | Net Active | -1.80 | -7.85 | -4.33 | -2.59 | -0.32 | 0.09 | 1.67 | 4 |
| S&P/ASX 200 Accumulation Index | Benchmark | Gross Return | 4.05 | 6.11 | 10.62 | 7.77 | 9.45 | 8.76 | 7.20 | 5 |
* Inception date is 11 September 2006. Returns are calculated before fees have been deducted, assuming reinvestment of distributions. No allowance is made for tax. Past performance is not a reliable indicator of future performance.
**Numbers may not add due to rounding.
**Numbers may not add due to rounding.
Fund Performance (Net) as at 30 June 2026
| . | 3 months (%) | 1 year (%) | 3 years (%) p.a. | 5 years (%) p.a. | 10 years (%) p.a. | 15 years (%) p.a. | Since inception (%) p.a.* | |||
|---|---|---|---|---|---|---|---|---|---|---|
| Greencape High Conviction Fund | Fund | Gross Return | 2.48 | -0.85 | 7.27 | 6.18 | 10.31 | 10.01 | 10.10 | 1 |
| Greencape High Conviction Fund | ActiveReturn | Gross Active | -1.57 | -6.96 | -3.35 | -1.58 | 0.86 | 1.25 | 2.91 | 2 |
| Greencape High Conviction Fund | Fund | Net Return | 2.25 | -1.74 | 6.29 | 5.18 | 9.13 | 8.85 | 8.87 | 3 |
| Greencape High Conviction Fund | ActiveReturn | Net Active | -1.80 | -7.85 | -4.33 | -2.59 | -0.32 | 0.09 | 1.67 | 4 |
| S&P/ASX 200 Accumulation Index | Benchmark | Gross Return | 4.05 | 6.11 | 10.62 | 7.77 | 9.45 | 8.76 | 7.20 | 5 |
* Inception date is 11 September 2006. Returns are calculated before fees have been deducted, assuming reinvestment of distributions. No allowance is made for tax. Past performance is not a reliable indicator of future performance.
**Numbers may not add due to rounding.
**Numbers may not add due to rounding.